This Dataviz project was made in collaboration with Andrea Rodriguez.
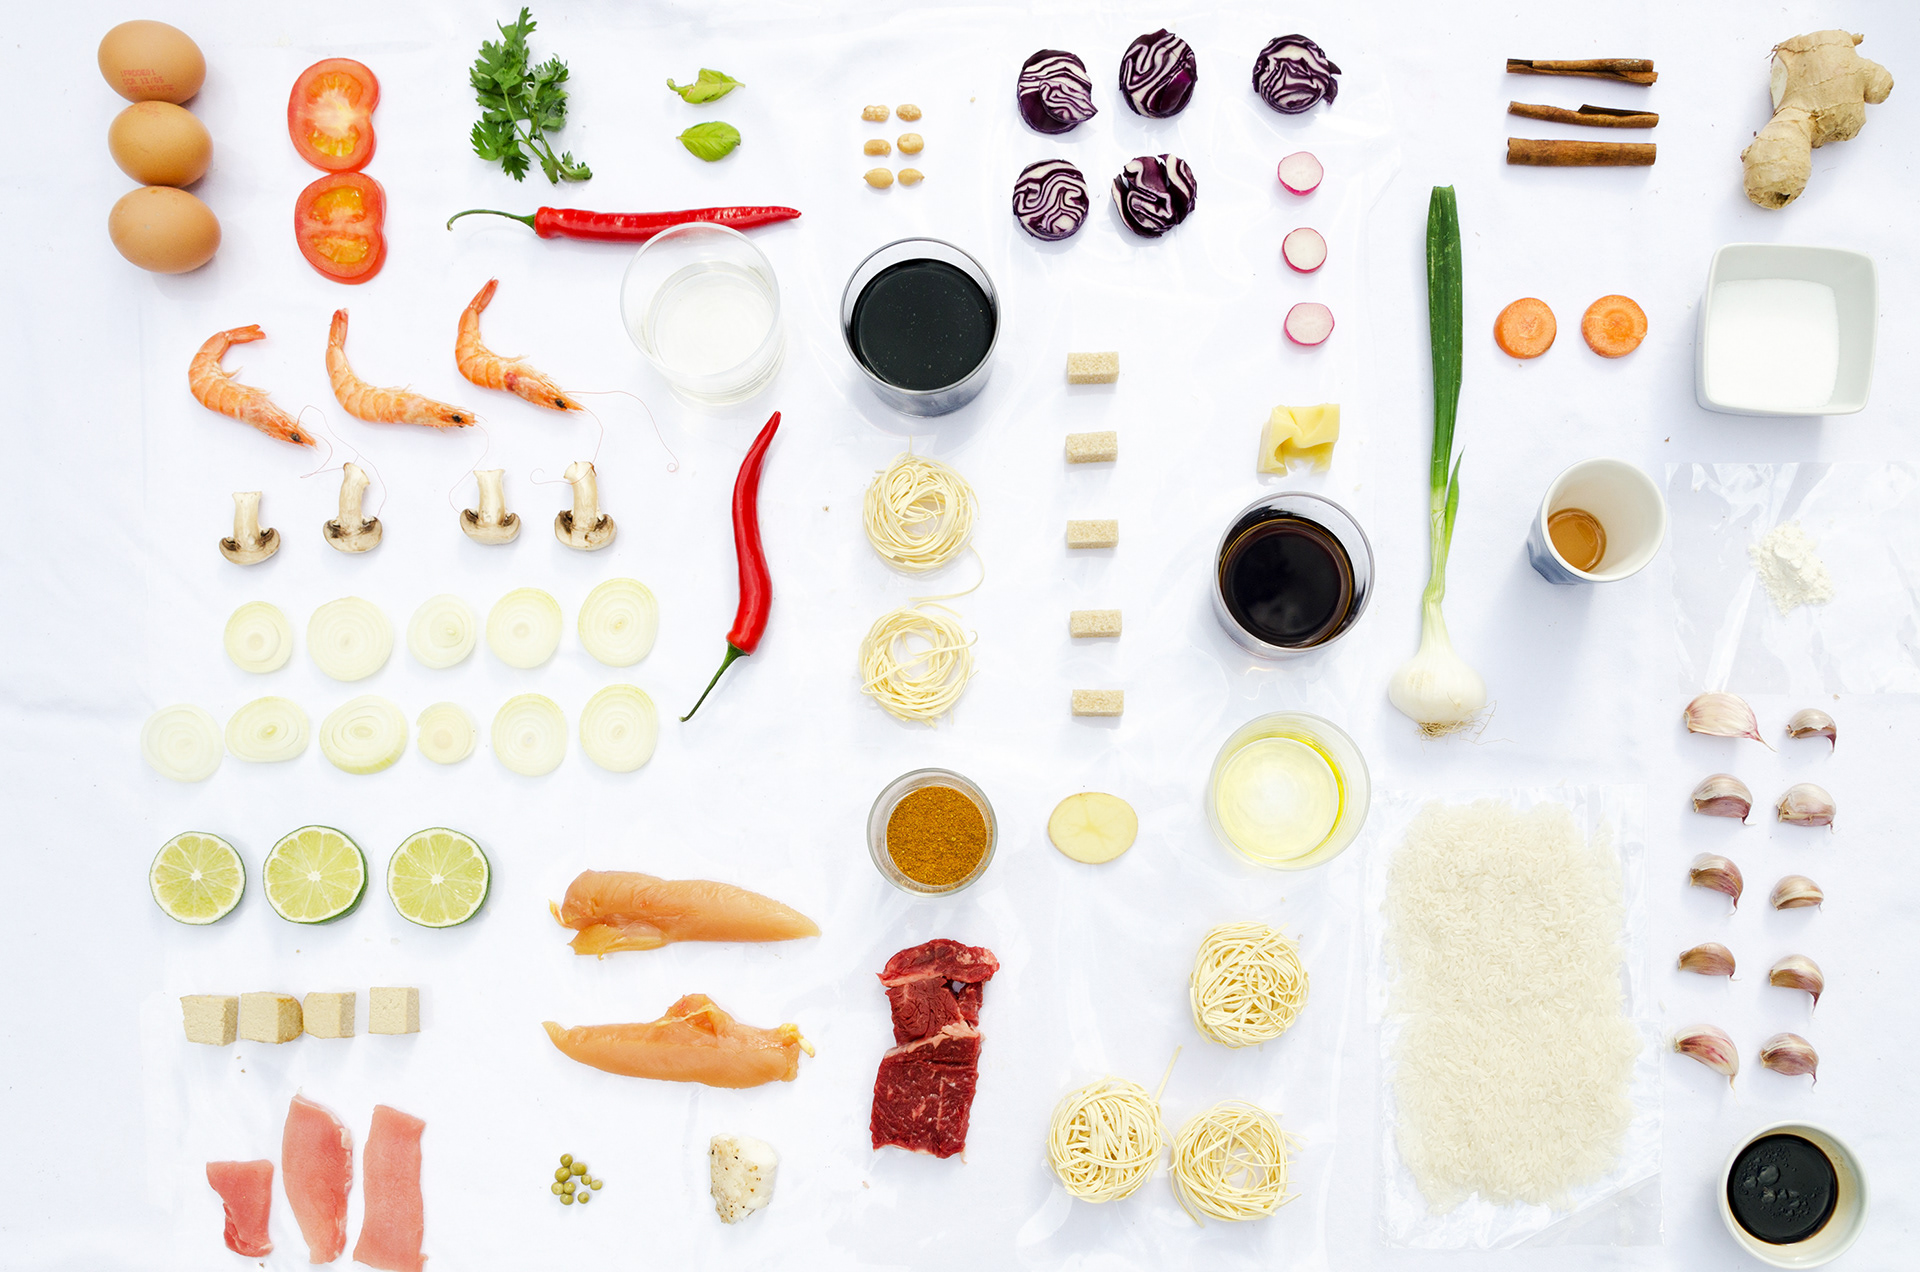
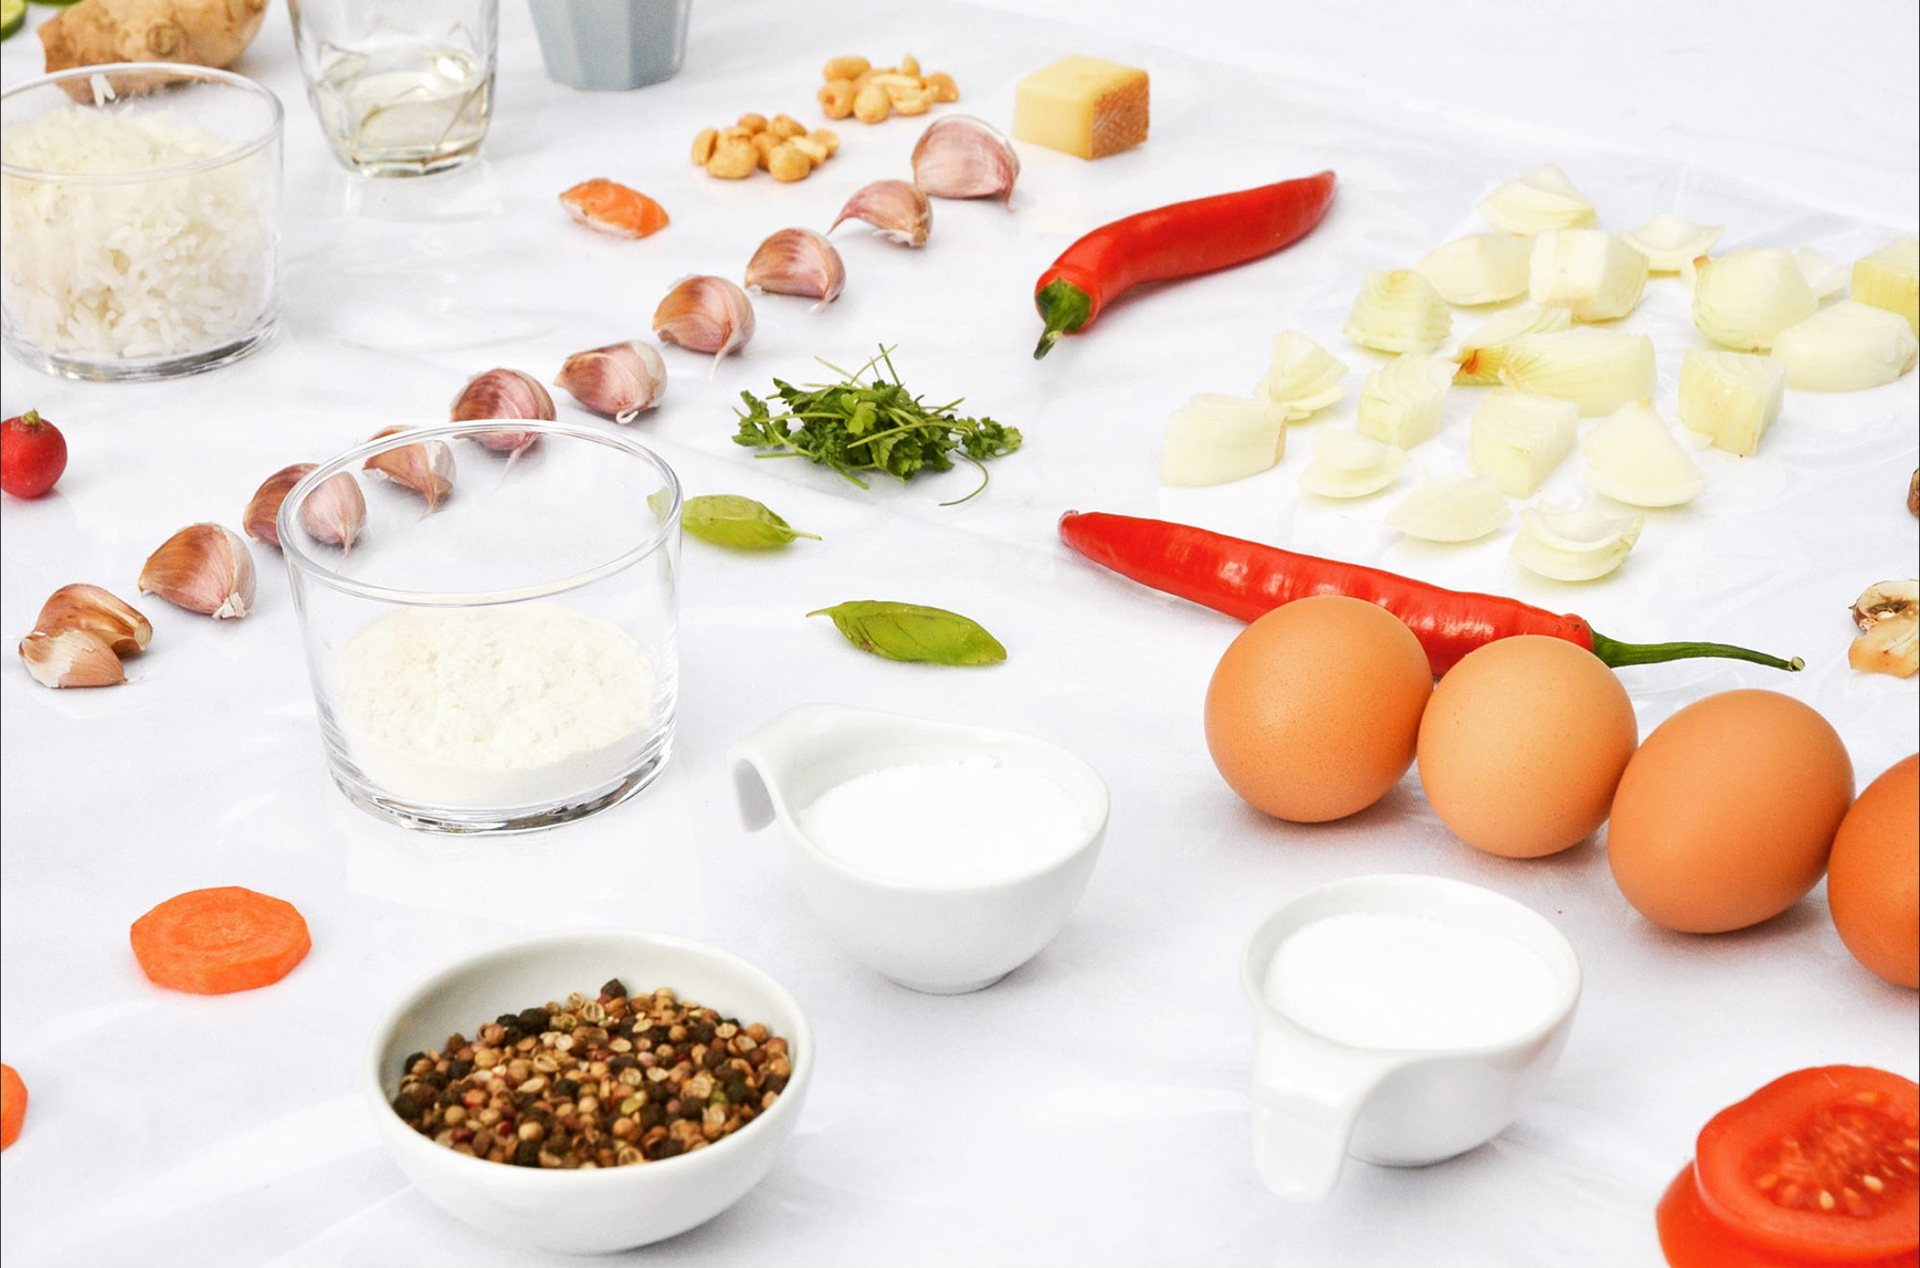
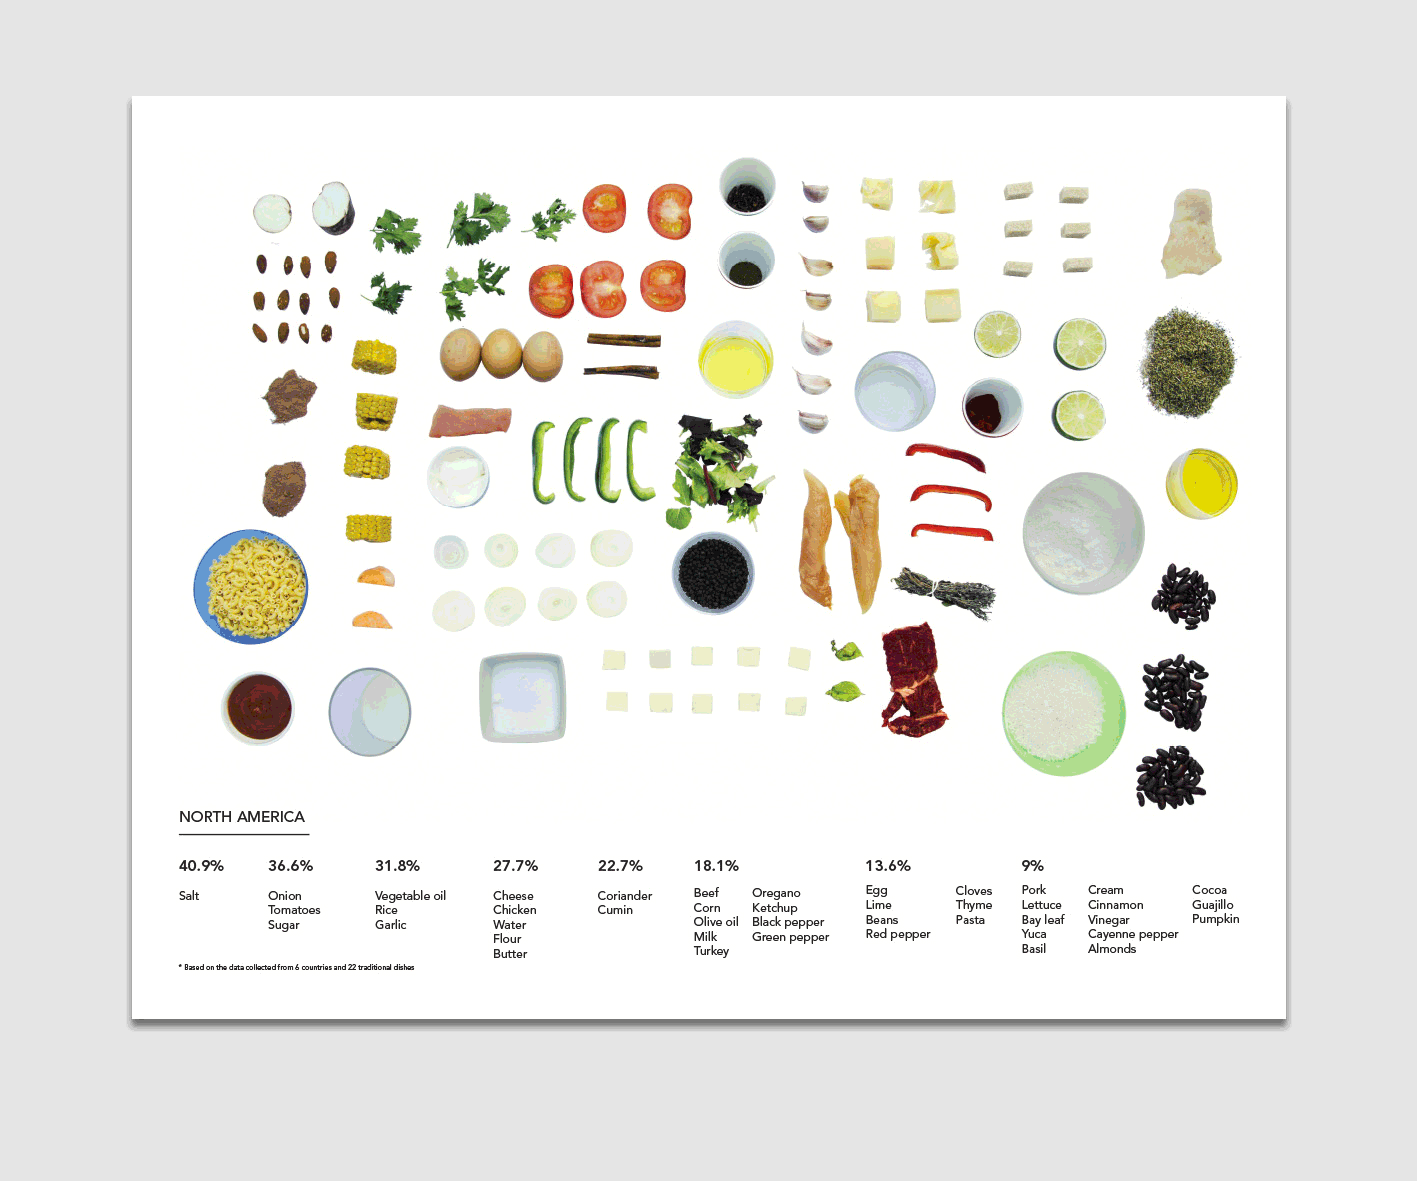
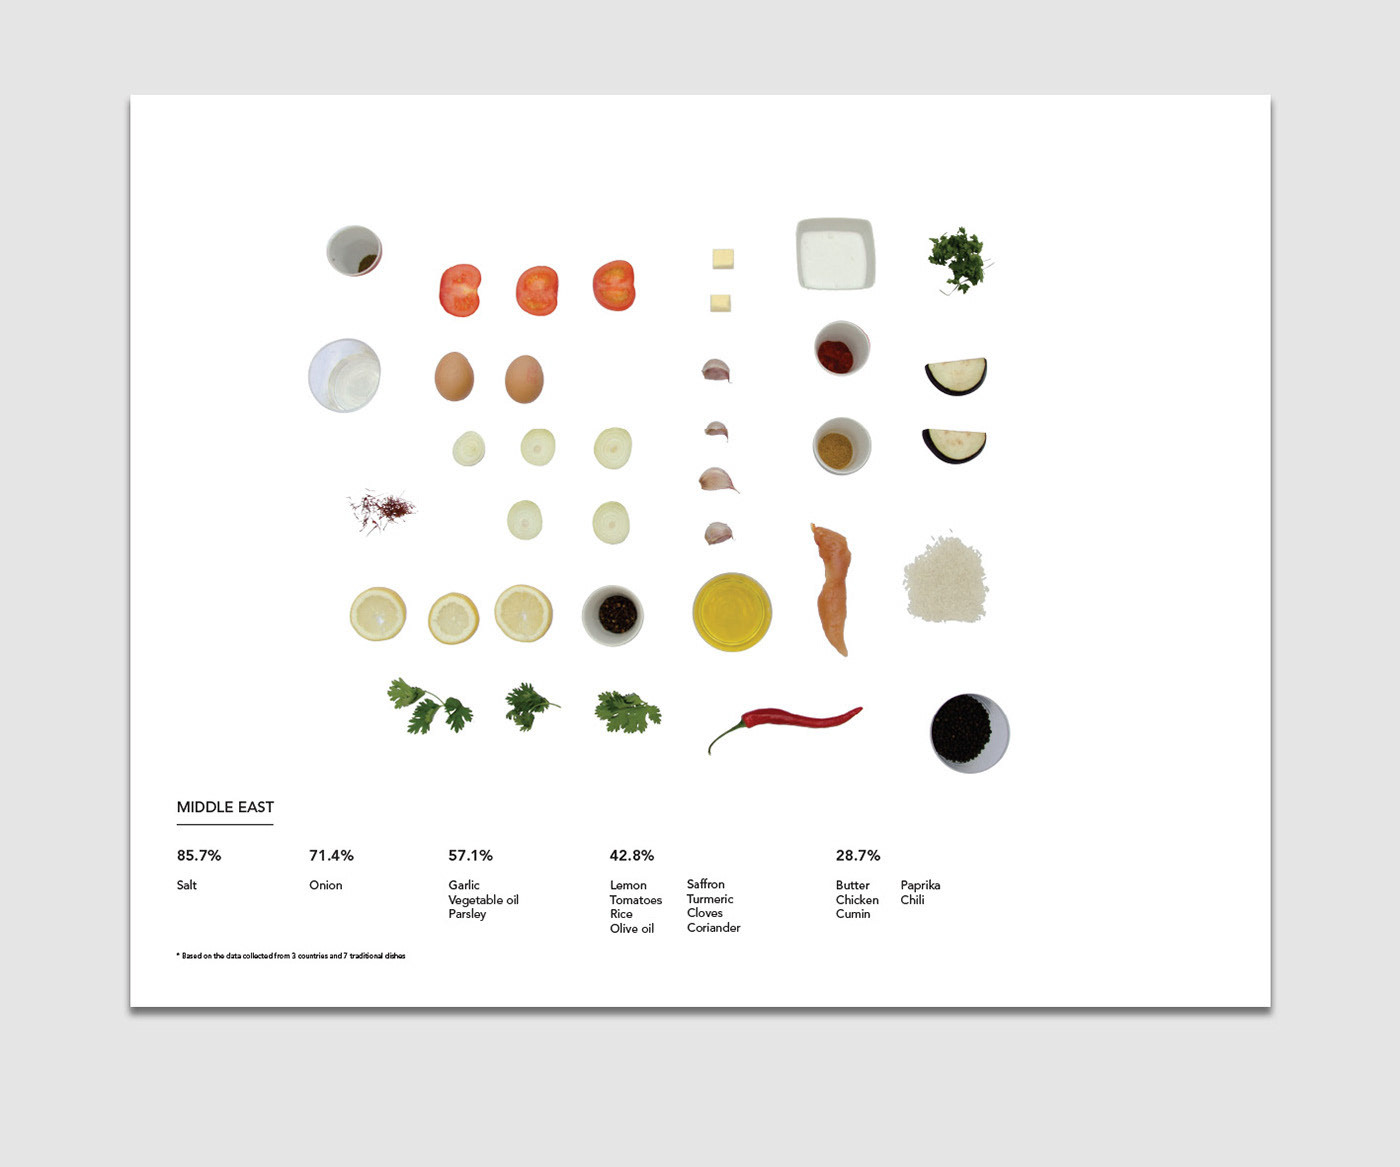
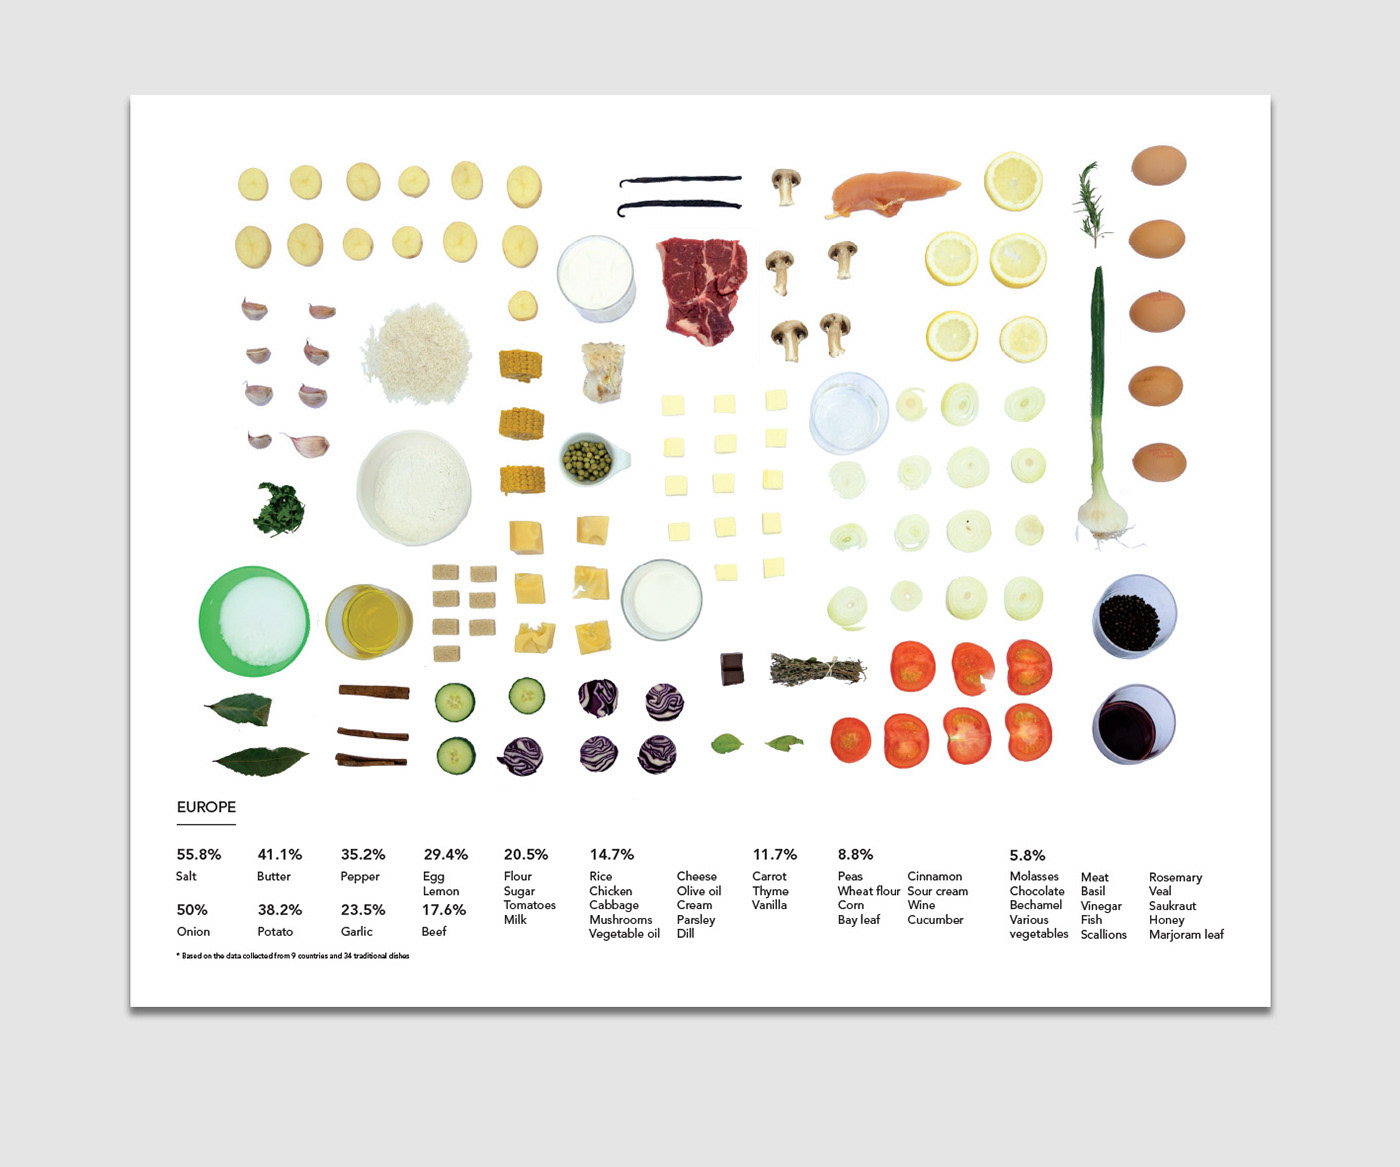
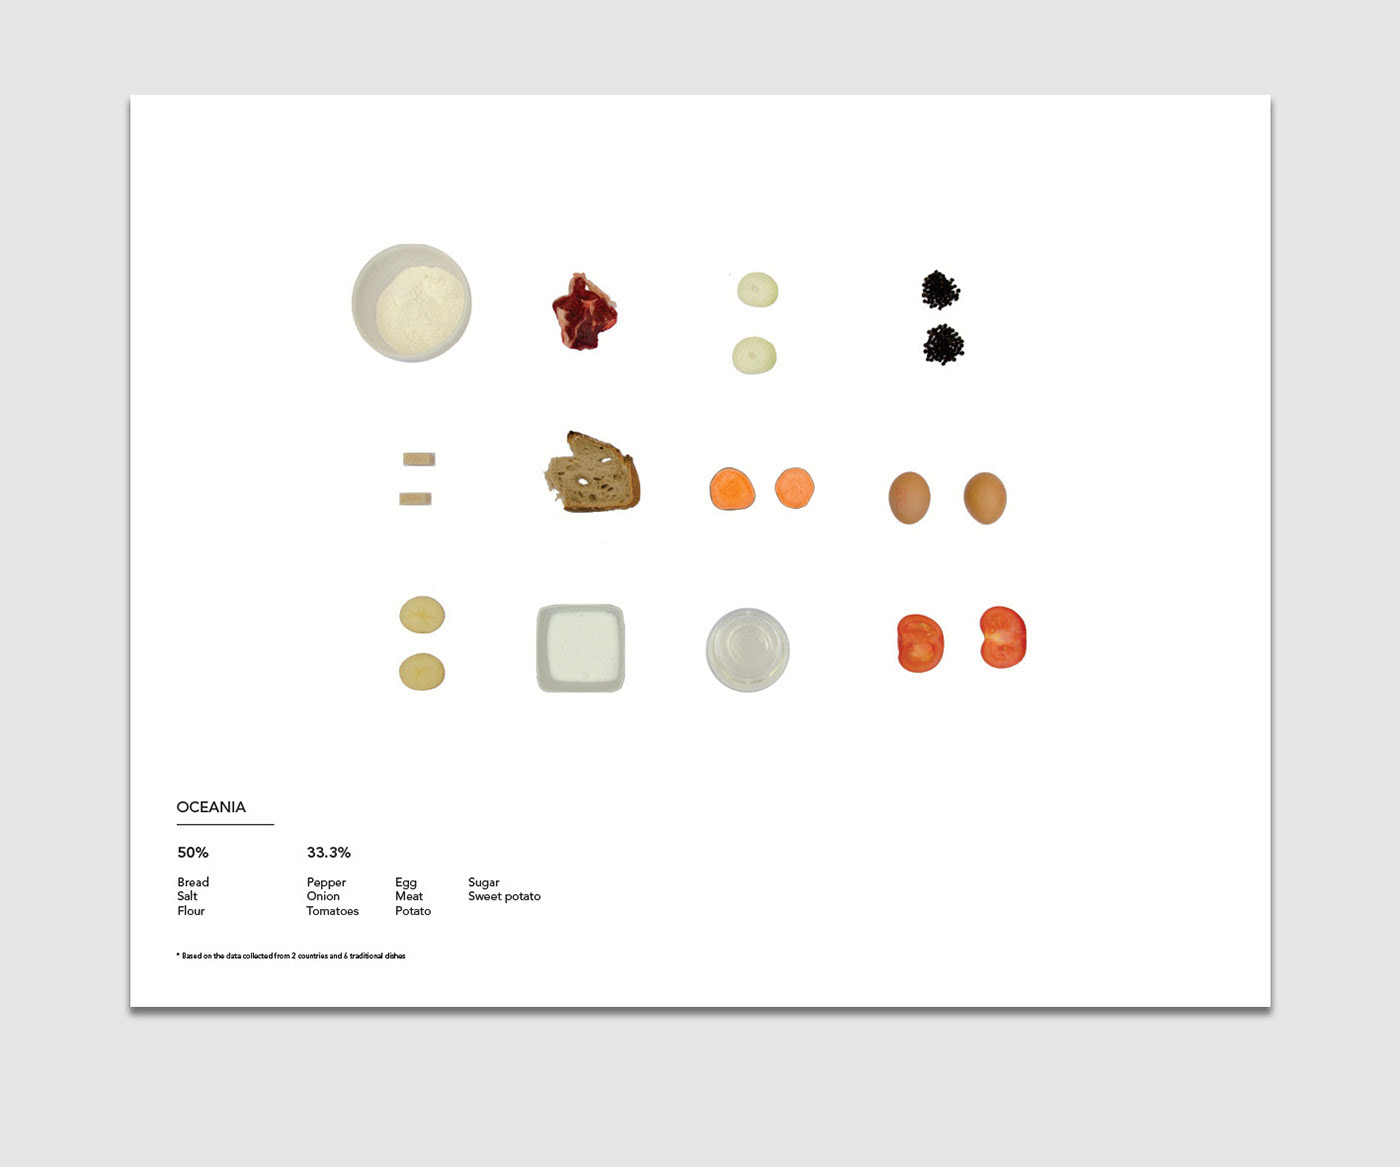
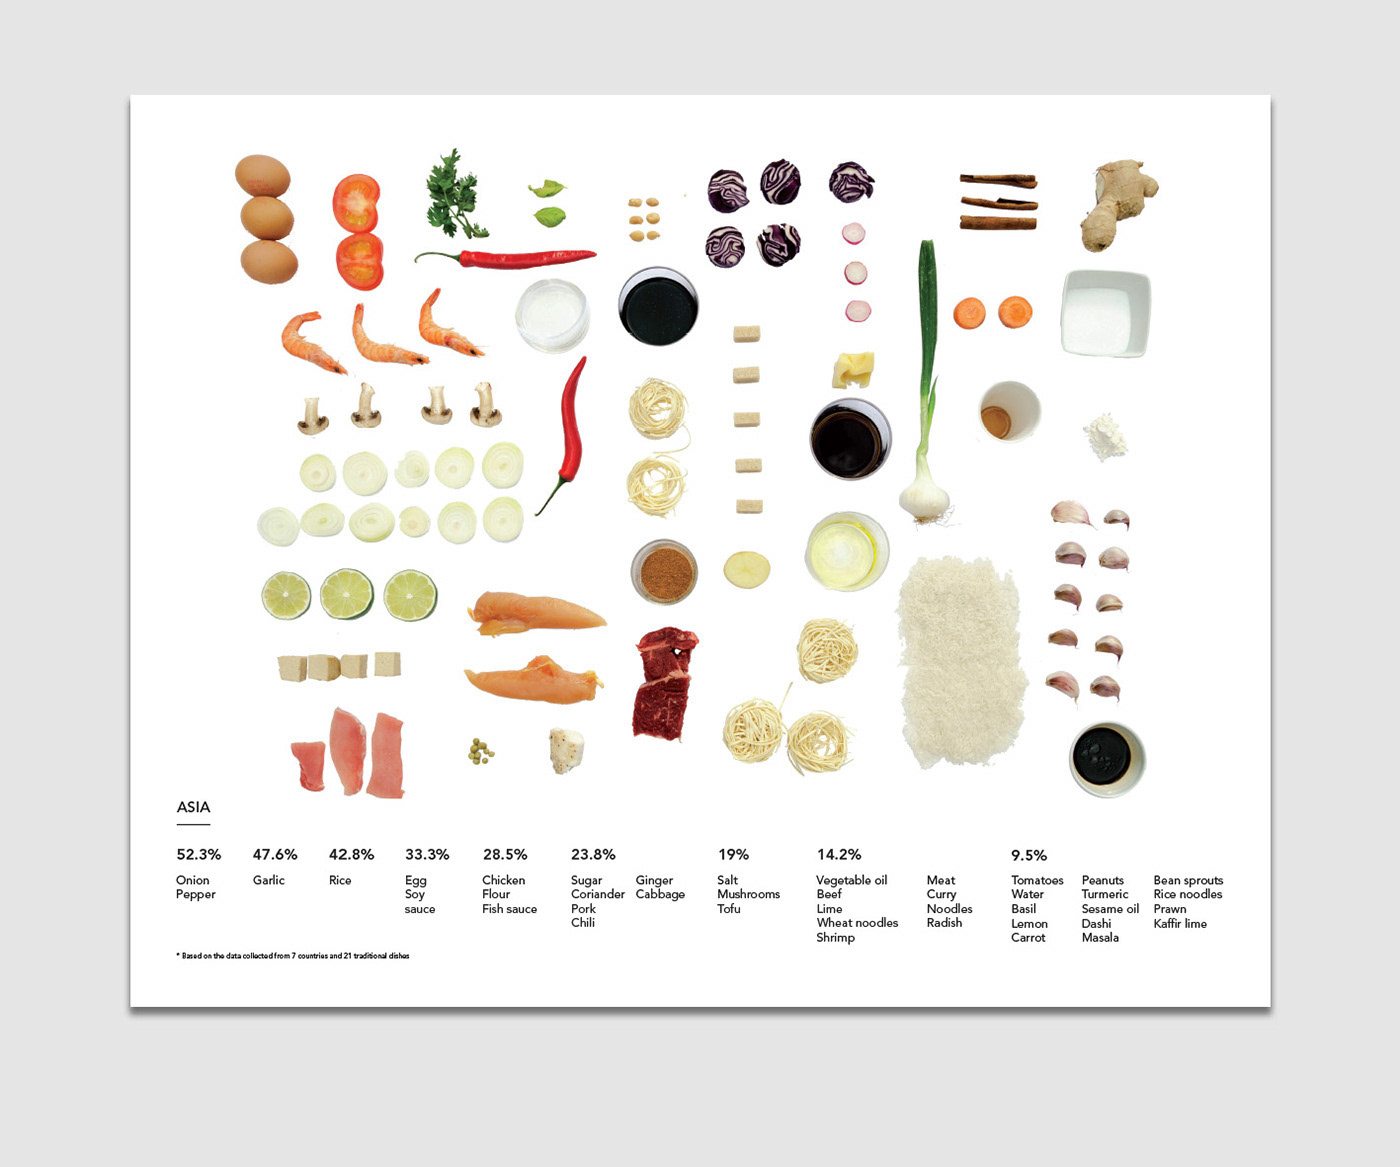
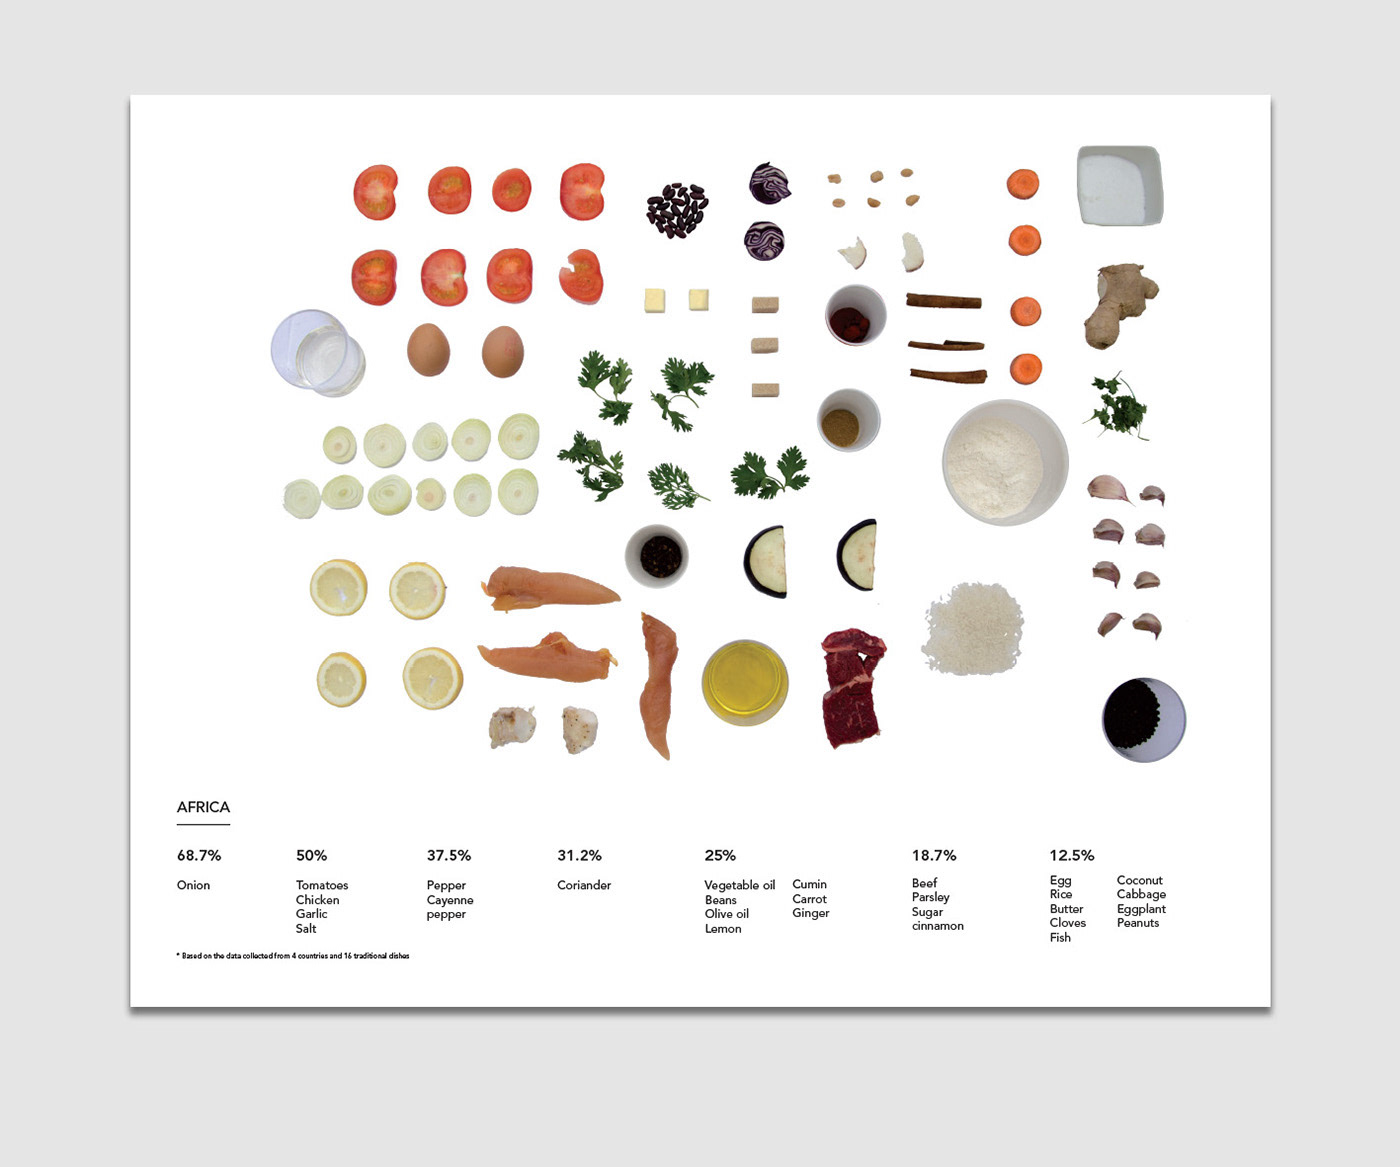
We classified ingredients according to the traditional dishes of 40 countries, all over the world.
We made real-life dataviz boards of the most used ingredients in these national dishes, one for each continent.
We discovered what it tells us about the way each continent eats.
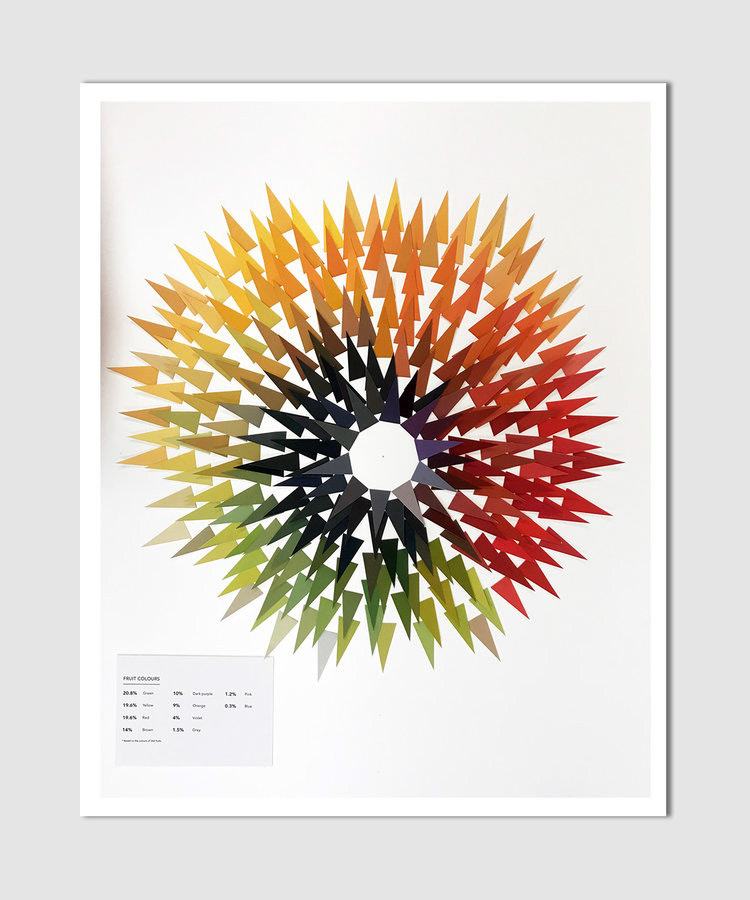
Moreover, we analized all the colours from all the fruits in the world (scroll down to see the colour wheel of fruits), artistically representing the most and less existing colour in fruits.
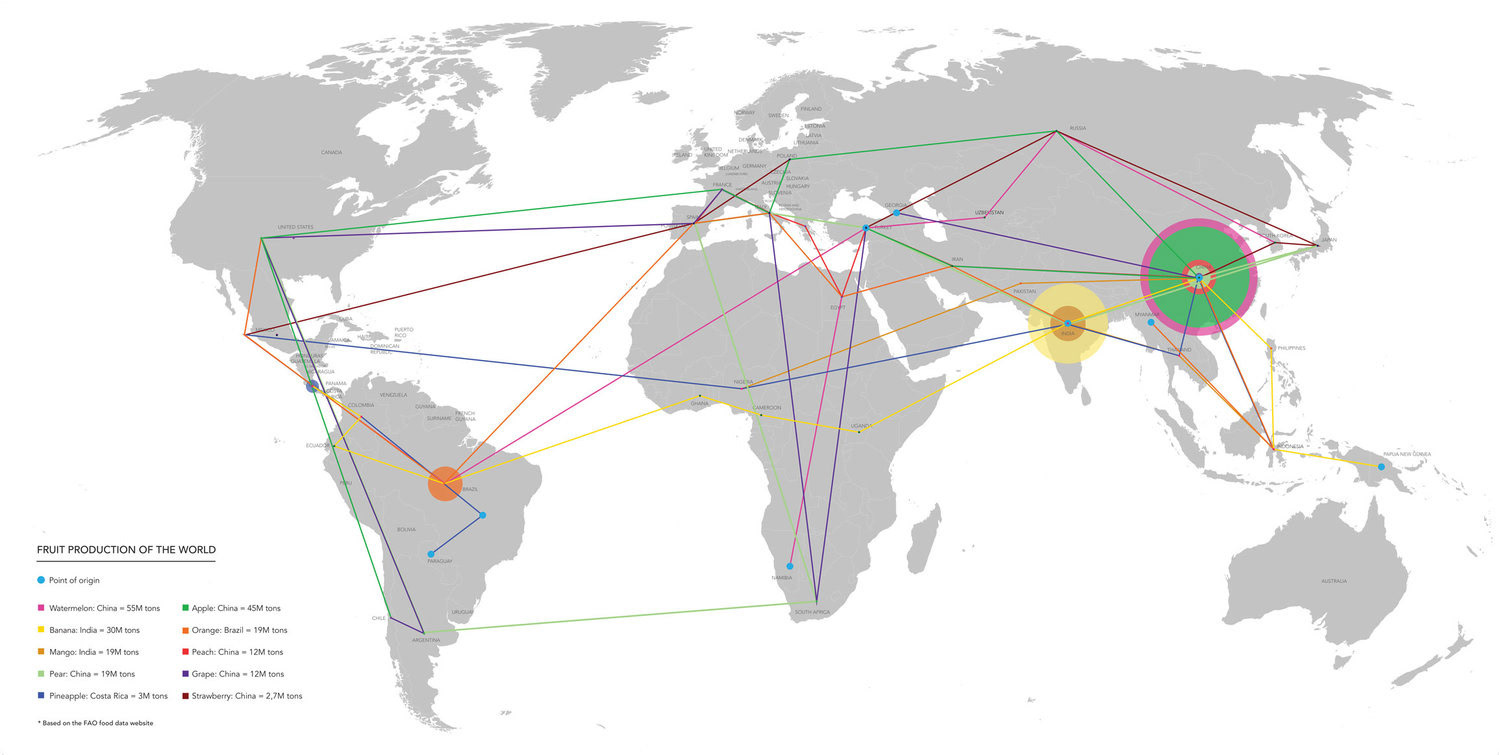
We finally created a map of the production rout of fruits (from n°1 city-Producer to n°1 city-Consumer).